
Americans aren’t happy with their economy. In October, Pew Research reported that “26 percent now say economic conditions are excellent or good, while 74 percent say they are only fair or poor.” This weighs heavily on their minds. In December, Gallup reported 35 percent of Americans “naming any economic issue” as “the most important problem facing this country today,” up from 24 percent in October.
Together, this is a significant headwind for Republicans entering an election year. But, for whatever it’s worth, it could be worse. Indeed, the average American’s economic conditions would be worse in most of the developed world.
“I Once Thought Europeans Lived as Well as Americans,” economist Tyler Cowen wrote in the Free Press last year; “Not Anymore.”
“I went to live in Germany as a student in 1984, and I marveled at how many things were better there than in the United States,” Cowen writes. “Now, 40 years later, I’ve massively revised my original judgments. I go to Europe at least twice a year, and have been to almost every country there. More and more I look to it for its history — not for its living standards.”
Total vs Per Capita GDP Growth
“In terms of per capita income,” Cowen notes, “America has opened up a big and apparently growing lead over West Europe.”
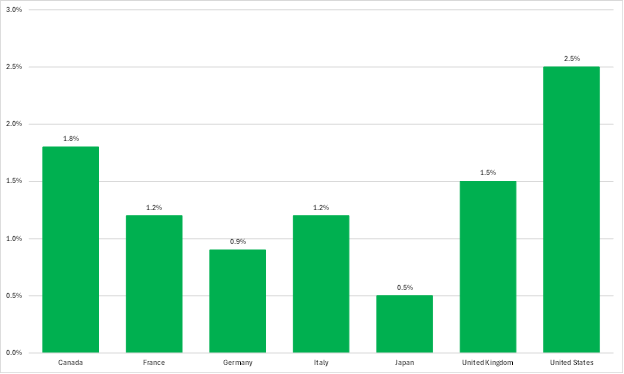
Indeed, over the last ten years, real Gross Domestic Product (GDP) growth has averaged 2.5 percent annually in the United States. This is the best performance among the G7 nations, ranking well ahead of Canada, in second place, with 1.8 percent, and Italy in third, with 1.2 percent, less than half the US rate (Figure 1).
Figure 1: Average annual real GDP growth, 2014-2015 to 2023-2024 (PPP, constant 2021 international $)
World Bank World Development Indicators
But when discussing economic growth, one should always be clear whether they are discussing total GDP, given above, or per capita GDP, as Cowen is, which is what matters most for living standards. If we subtract the average annual growth rate of the population from the average annual growth rate of real total GDP, we are left with the average annual growth rate of real GDP per capita (Figure 2).
The numbers for per capita GDP growth tell a very different story. The United States is still top of the G7 with an average real per capita GDP growth rate of 1.8 percent annually. But Canada slumps from second to bottom. Fully 1.5 percentage points — 88 percent — of its 1.8 percent average annual growth in total GDP can be attributed to increases in the population. Despite impressive total GDP growth, the average Canadian has become little better off. Italy, by contrast, rises from third to second. While its population declined at an average annual rate of 0.2 percent — the second worst performance — its per capita GDP grew at an average rate of 1.4 percent annually.
Figure 2: Components of annual real GDP growth, 2014-2015 to 2023-2024, percentage points
World Bank World Development Indicators
Immigration and Economic Growth
There is no strong relationship here between population growth and real per capita GDP growth. Indeed, many of those who propose increased immigration as the path to faster GDP growth are talking about faster total GDP growth — the dismal Canadian model — rather than faster per capita GDP growth. When it is not clear whether someone is opining on total GDP or per capita GDP, they should be pressed for clarification.
Whether or not immigration boosts per capita GDP growth depends on two things. First, are the immigrants, on average, more or less likely than the population currently resident to be employed? Second, are the immigrants, on average, more or less skilled than the population currently resident? Consider that GDP per capita is just GDP / Population.
If the answer to both of these questions is “more,” then the immigrants add more to the numerator (GDP) than the denominator (population), and GDP per capita increases. If the answer to both is “less,” then the opposite happens, and per capita GDP falls. The honest answer to whether immigration boosts per capita GDP growth is “it depends.” On the whole, skilled workers will increase per capita GDP, and the Trump administration’s attempts to restrict the entry of skilled workers are misguided.
Cowen argues that the United States has been more fortunate with its immigrants, in economic terms, than Europe.
“The problem, to put it bluntly,” he writes, “is that many of Europe’s immigrants are from quite different non-Western cultures. Furthermore, Europe is not always drawing in the top achievers from those cultures, whereas in America, Indian and Pakistani immigrants are quite successful…”
Immigrants drawn to American opportunity add more to the numerator than to the denominator.
Productivity and Economic Growth
This explains part of the faster growth in GDP per worker in the United States, which, in turn, explains part of the faster growth in GDP per capita. In terms of GDP per person employed, the average annual real growth rate in the United States over the past 10 years was 1.5 percent, more than twice that of the second-placed United Kingdom, with 0.6 percent (Figure 3).
Figure 3: Average annual real GDP per worker growth, 2014-2015 to 2023-2024 (US dollars, PPP converted, Billions, Chain linked volume (rebased), 2020)
But Cowen notes that “Paul Krugman frequently put forward the argument that American and West European living standards are roughly the same, with Americans earning more but working longer hours.” And there is truth in this. American workers, on average, work longer hours than their G7 counterparts (Figure 4).
Figure 4: Average hours worked per year per person, 2024
But this is a level, and we have been investigating rates of growth.
Growth in GDP per worker can be broken down into that share which comes from a worker working more hours and that which comes from a worker becoming more productive. When we break down the rates of per worker GDP growth shown above, we see, again, a different story. The United States saw a faster rate of per worker productivity growth between 2015 and 2024 than any other G7 country, more than twice the rate of Germany, in second place (Figure 5).
Figure 5: Average annual growth rates, 2014-2015 to 2023-2024
Cowen says that “as history unfolds, [Krugman’s] view seems increasingly untenable,” and he is likely correct.
American labor productivity growth does stand out among comparably rich countries and explains a good deal of why it’s per capita GDP growth stands out. Paul Krugman is wrong again.