
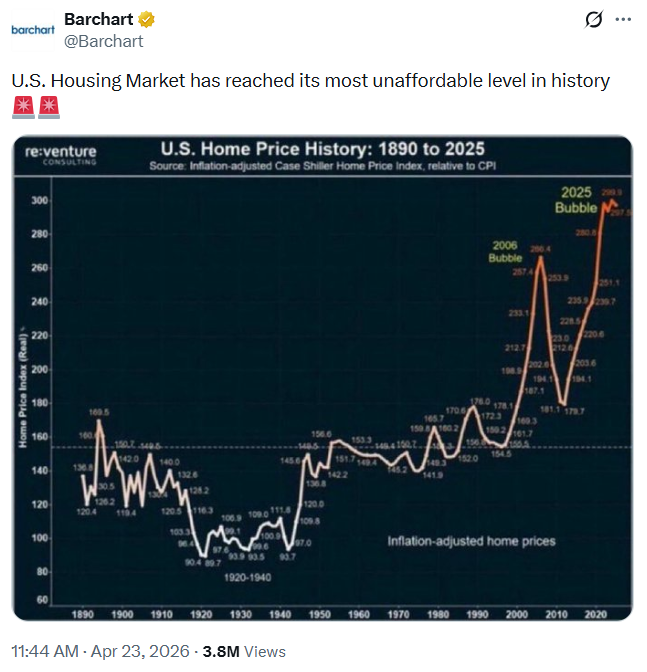
Whether US home prices are “the most expensive ever” depends critically on how the current moment is interpreted — a point underscored by the conflicting signals emerging from recent housing data. In March, the median price of an existing home rose for the thiry-third consecutive month to a record level for that month, even as transaction volumes weakened and the spring buying season began on a notably soft footing. At the same time, economists at the National Association of Realtors report that home prices are at their highest levels on record even as sales have stalled, reflecting a market constrained by limited inventory, elevated mortgage rates, and weakening buyer confidence. Compounding this tension, affordability metrics have deteriorated to the point that buying is now more expensive than renting in most US markets, highlighting the extent to which financing costs and price levels have jointly eroded access to homeownership.
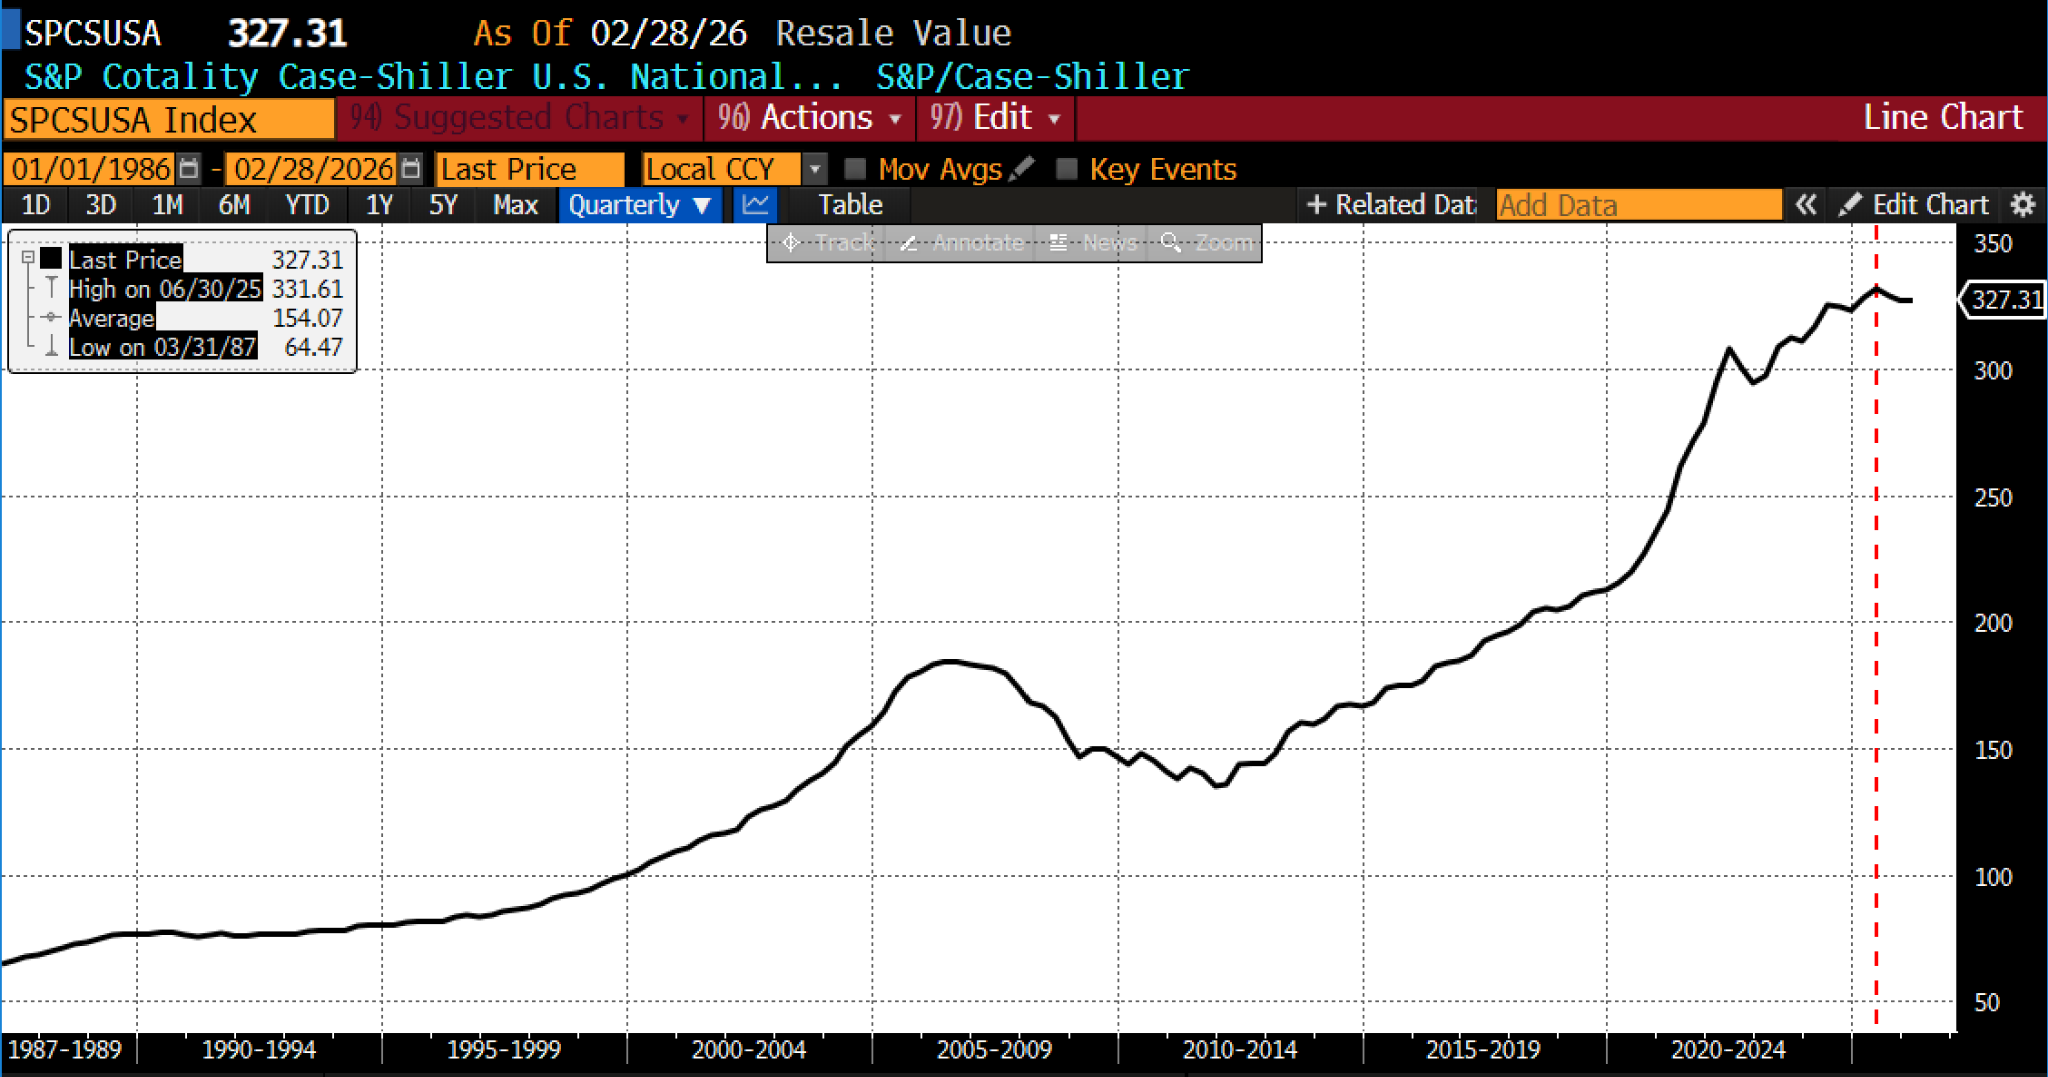
Consider first nominal price levels. By this standard, US housing remains essentially at record highs. The S&P CoreLogic Case-Shiller Home Price Index reached an all-time peak in 2025 and has remained close to that level into early 2026. Median home prices likewise continue to register elevated readings relative to historical norms, even as transaction volumes have softened. The persistence of high prices alongside declining or stagnant sales reinforces the extent to which supply constraints — rather than robust demand — are sustaining current valuations. On a nominal basis, therefore, housing remains nearly as expensive as it has ever been.
(Source: Bloomberg Finance, LP)
A second, more informative metric is the ratio of home prices to household income. On this measure, housing also appears historically stretched. The price-to-income ratio is currently in the range of six to seven times median household income, compared to roughly three to four times during the 1990s and early 2000s. While nominal wage growth has accelerated in recent years, it has not been sufficient to offset the substantial increase in home prices observed during the pandemic period. As a result, housing remains expensive relative to the earning capacity of typical households, a dynamic that helps explain the growing preference — or necessity — for renting over ownership in many markets.
This can be shown in several ways. A ‘big picture’ look can first be captured by the Federal Reserve’s Flow of Funds report on household net worth as a percentage of disposable personal income. While not a direct measure of home prices, household net worth relative to disposable income remains elevated, reflecting persistently high valuations across major asset classes, a major component of which is homeownership. This metric shows the ratio near, but not at, all-time highs:
(Source: Bloomberg Finance, LP)
A direct measurement is provided by the ratio of the median home price to median annual income. This measure, most recently in February 2026, is at an all-time high of 7.14.
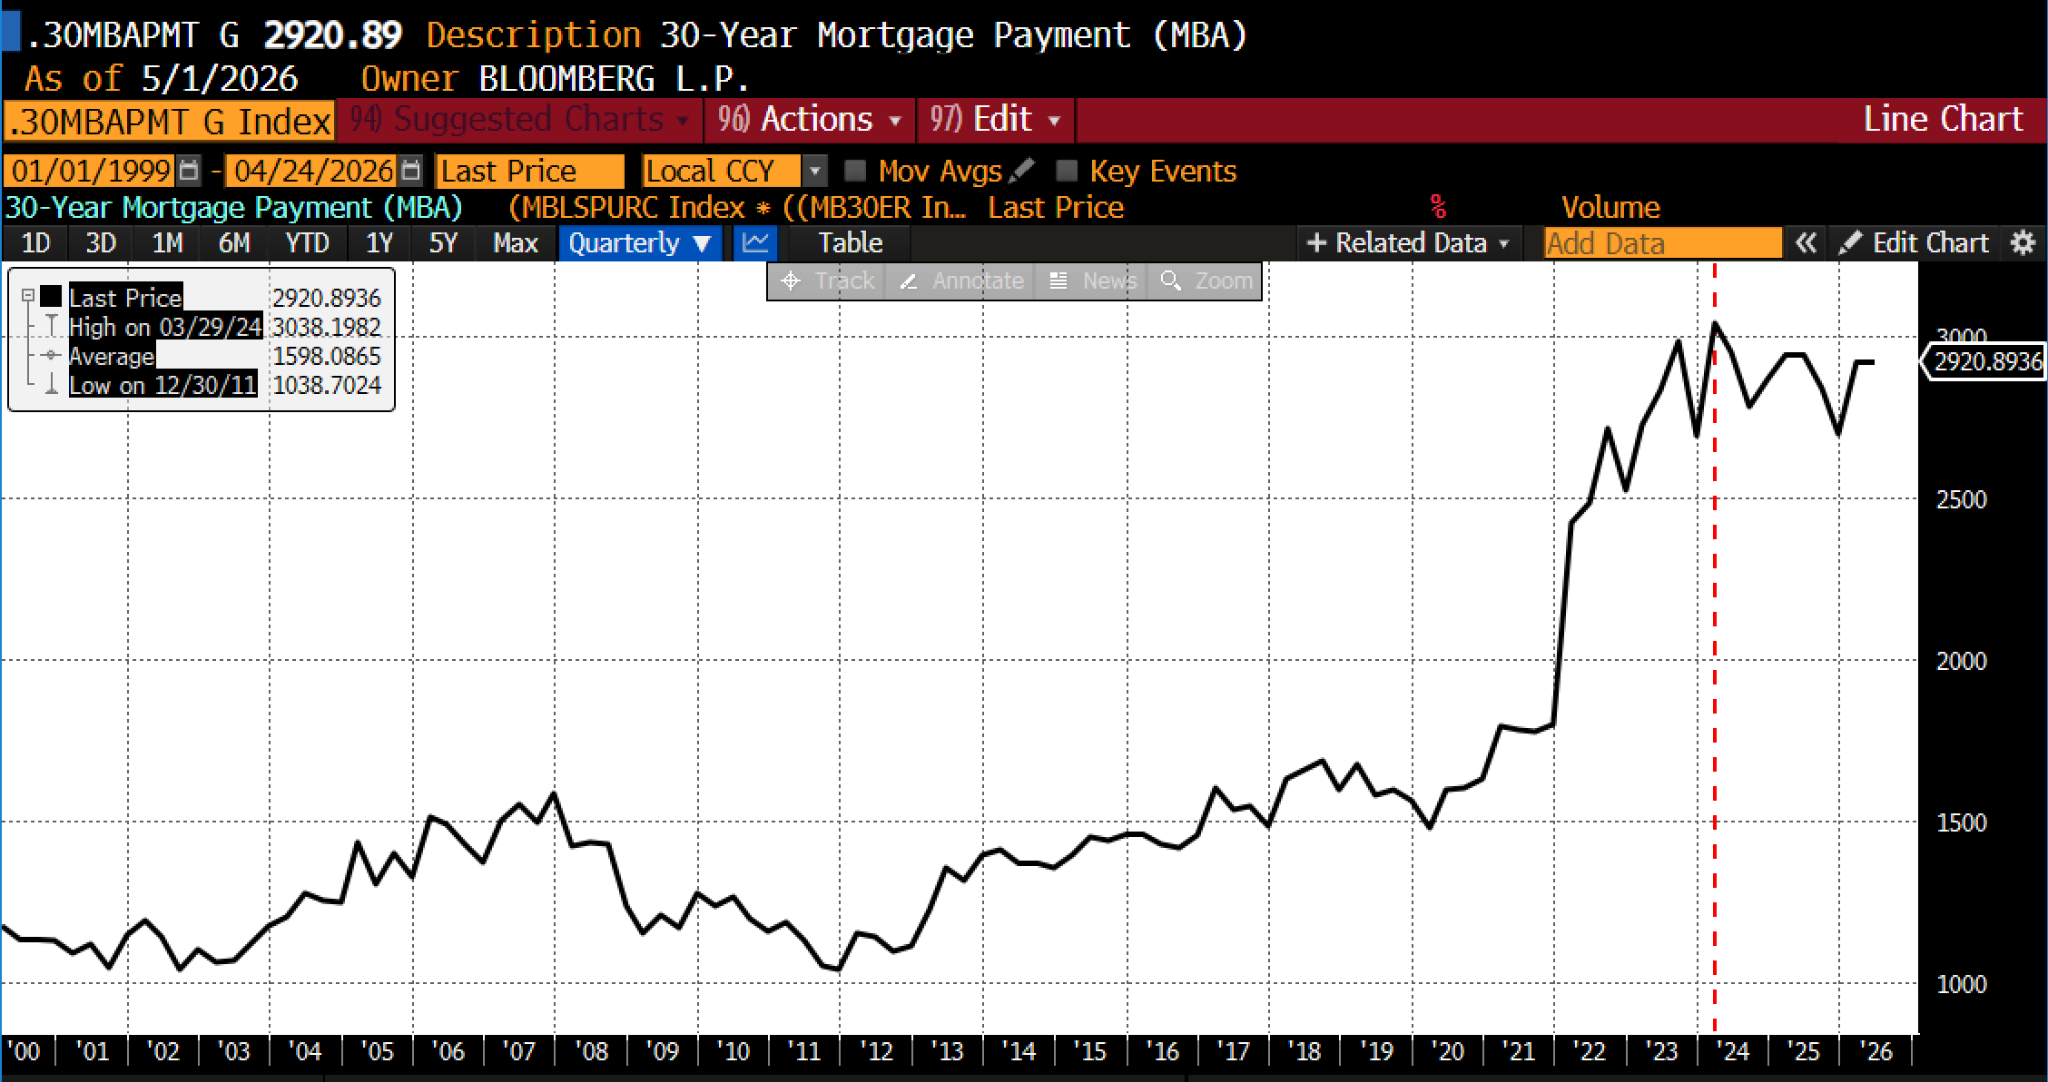
A strong case for housing being “more expensive than ever,” however, emerges from affordability metrics that incorporate financing costs. Mortgage rates, which rose sharply beginning in 2022 and reached a high of 8.06 percent (red vertical dashed line) in October 2023, remain in the vicinity of 6.35 percent: more than double (green horizontal dashed line) the pandemic-era low of 2.87 percent (blue horizontal dashed line).
(Source: Bloomberg Finance, LP)
This increase has materially altered the cost of homeownership. Monthly payments on a median-priced home now consume approximately 30 percent or more of median household income, compared to closer to 20 percent prior to the pandemic. And this has occurred amid rates of inflation still above the Fed’s 2 percent target.
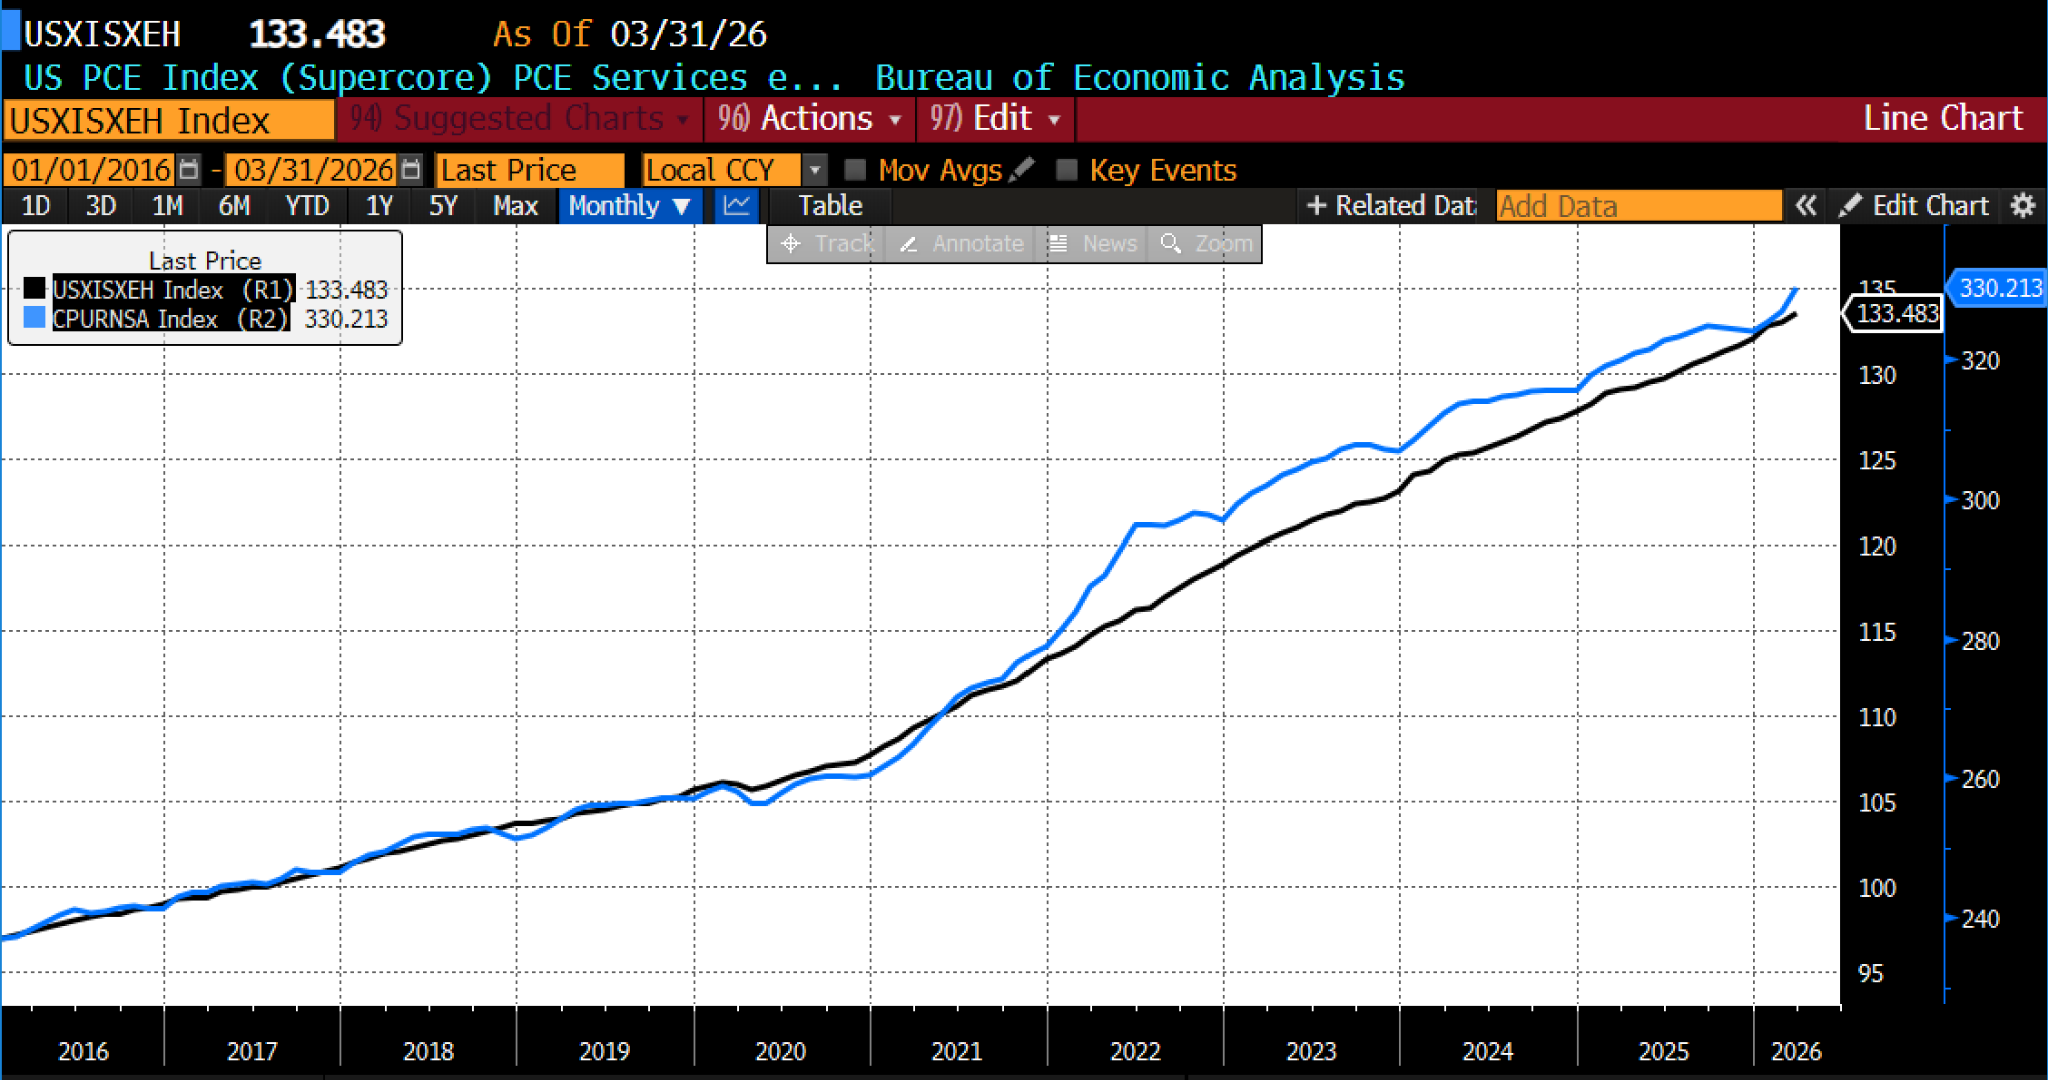
From the perspective of cash flow, this represents one of the least affordable housing environments in modern US history. From January 2020 to March 2026, prices rose roughly 28 percent overall (CPI headline) and about 26 percent even after stripping out energy and housing (PCE services supercore), suggesting that inflation has been broad-based and persistent rather than driven solely by volatile or housing-related components.
(Source: Bloomberg Finance, LP)
In this context, the fact that buying has become more expensive than renting in most markets is not surprising; it is the direct result of elevated prices interacting with higher borrowing costs. Even in the absence of further price increases, these financing conditions continue to impose a significant burden on prospective buyers. A back-of-the-envelope estimate of monthly mortgage costs, a substantial amount of which comes in the form of taxes, fees, and insurance, is provided by Bloomberg. Again, the amounts are near all-time highs, while not at all-time highs.
(Source: Bloomberg Finance, LP)
At the same time, several measures indicate that housing is no longer at peak expensiveness. The most straightforward is inflation-adjusted, or “real,” home prices. When nominal prices are adjusted for the general price level, the peak appears to have occurred between 2022 and 2025. Since then, elevated inflation has modestly eroded the real value of home prices, even as nominal levels have remained broadly stable. While the decline is not large, it is sufficient to suggest that the current market is somewhat less expensive in real terms than at its recent peak. These are depicted here:
(Source: Bloomberg Finance, LP)
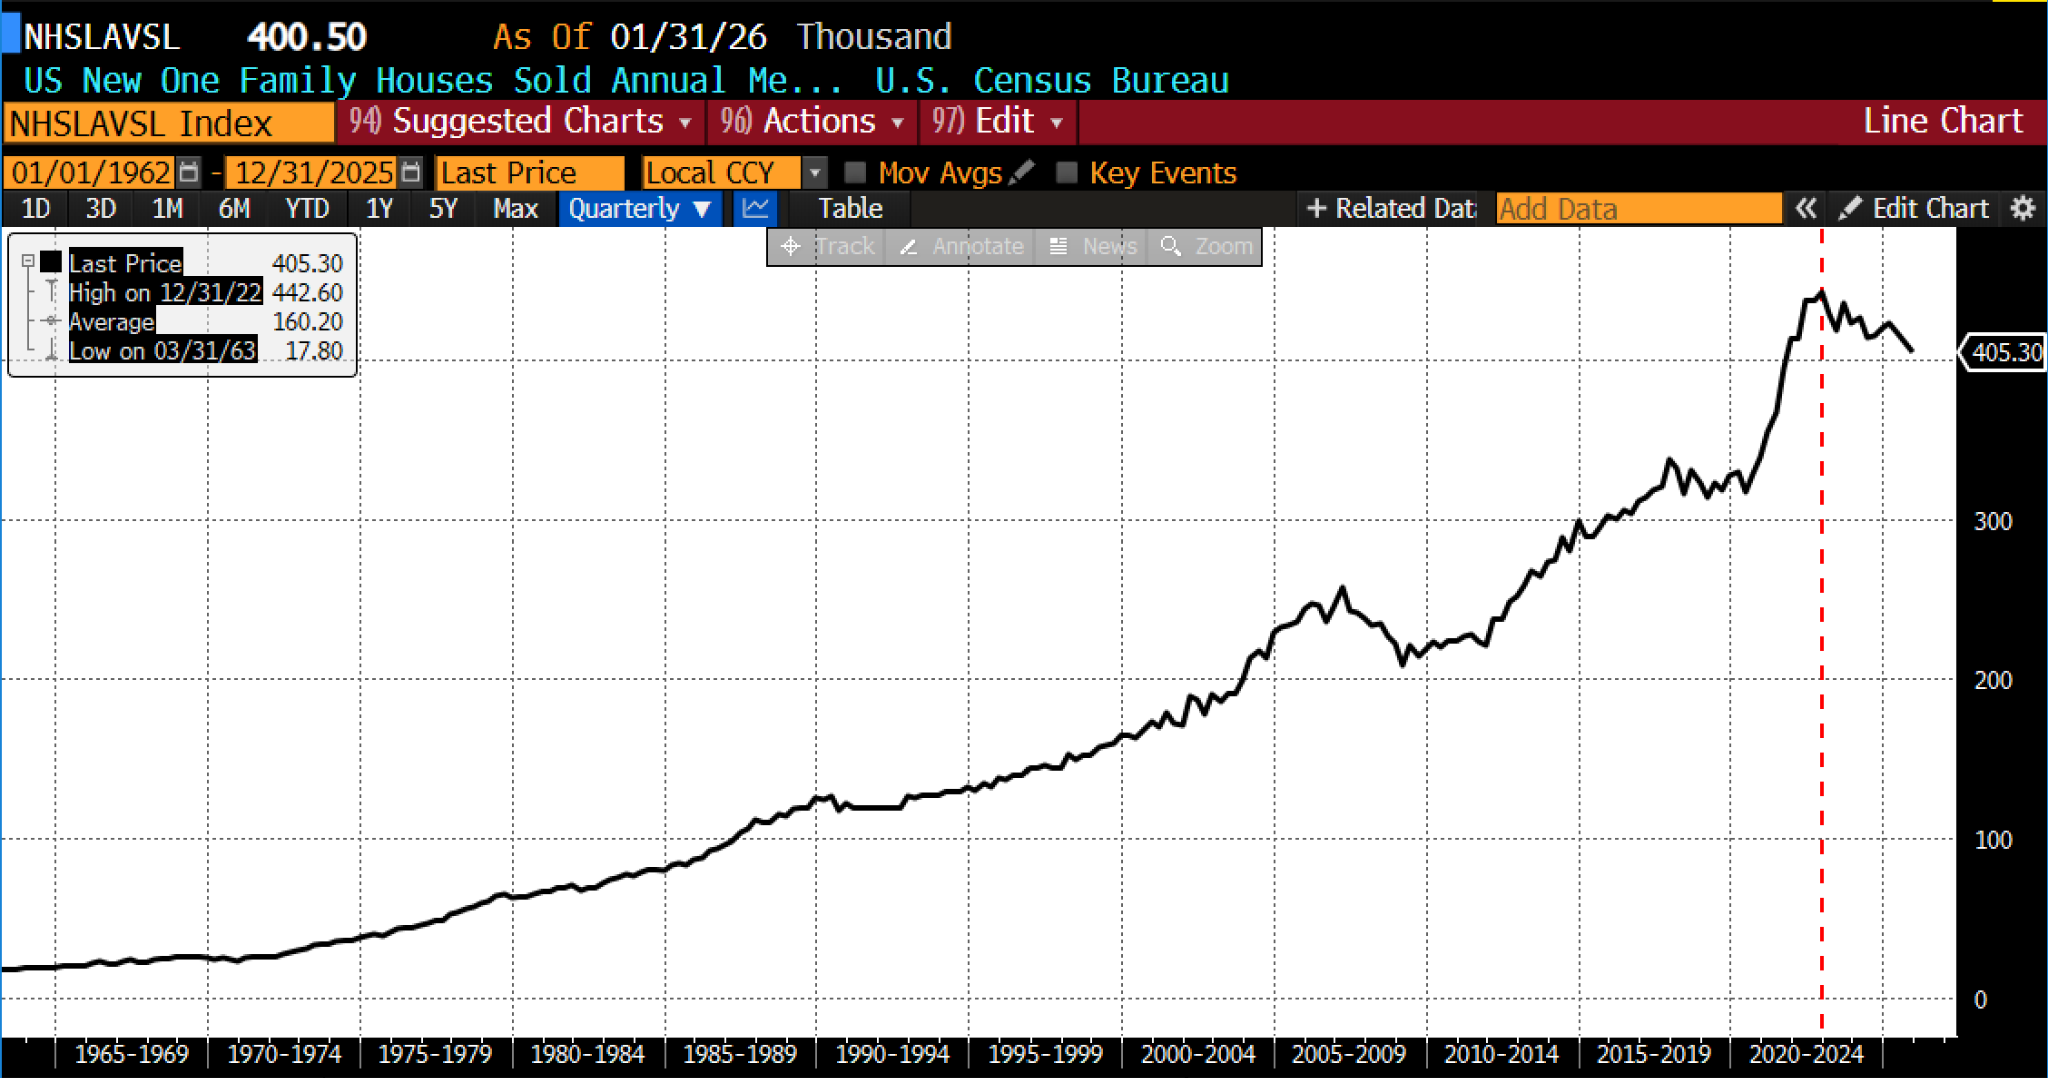
And another, broader measure uses data from both the US Department of Housing and Urban Development and the Census Bureau.
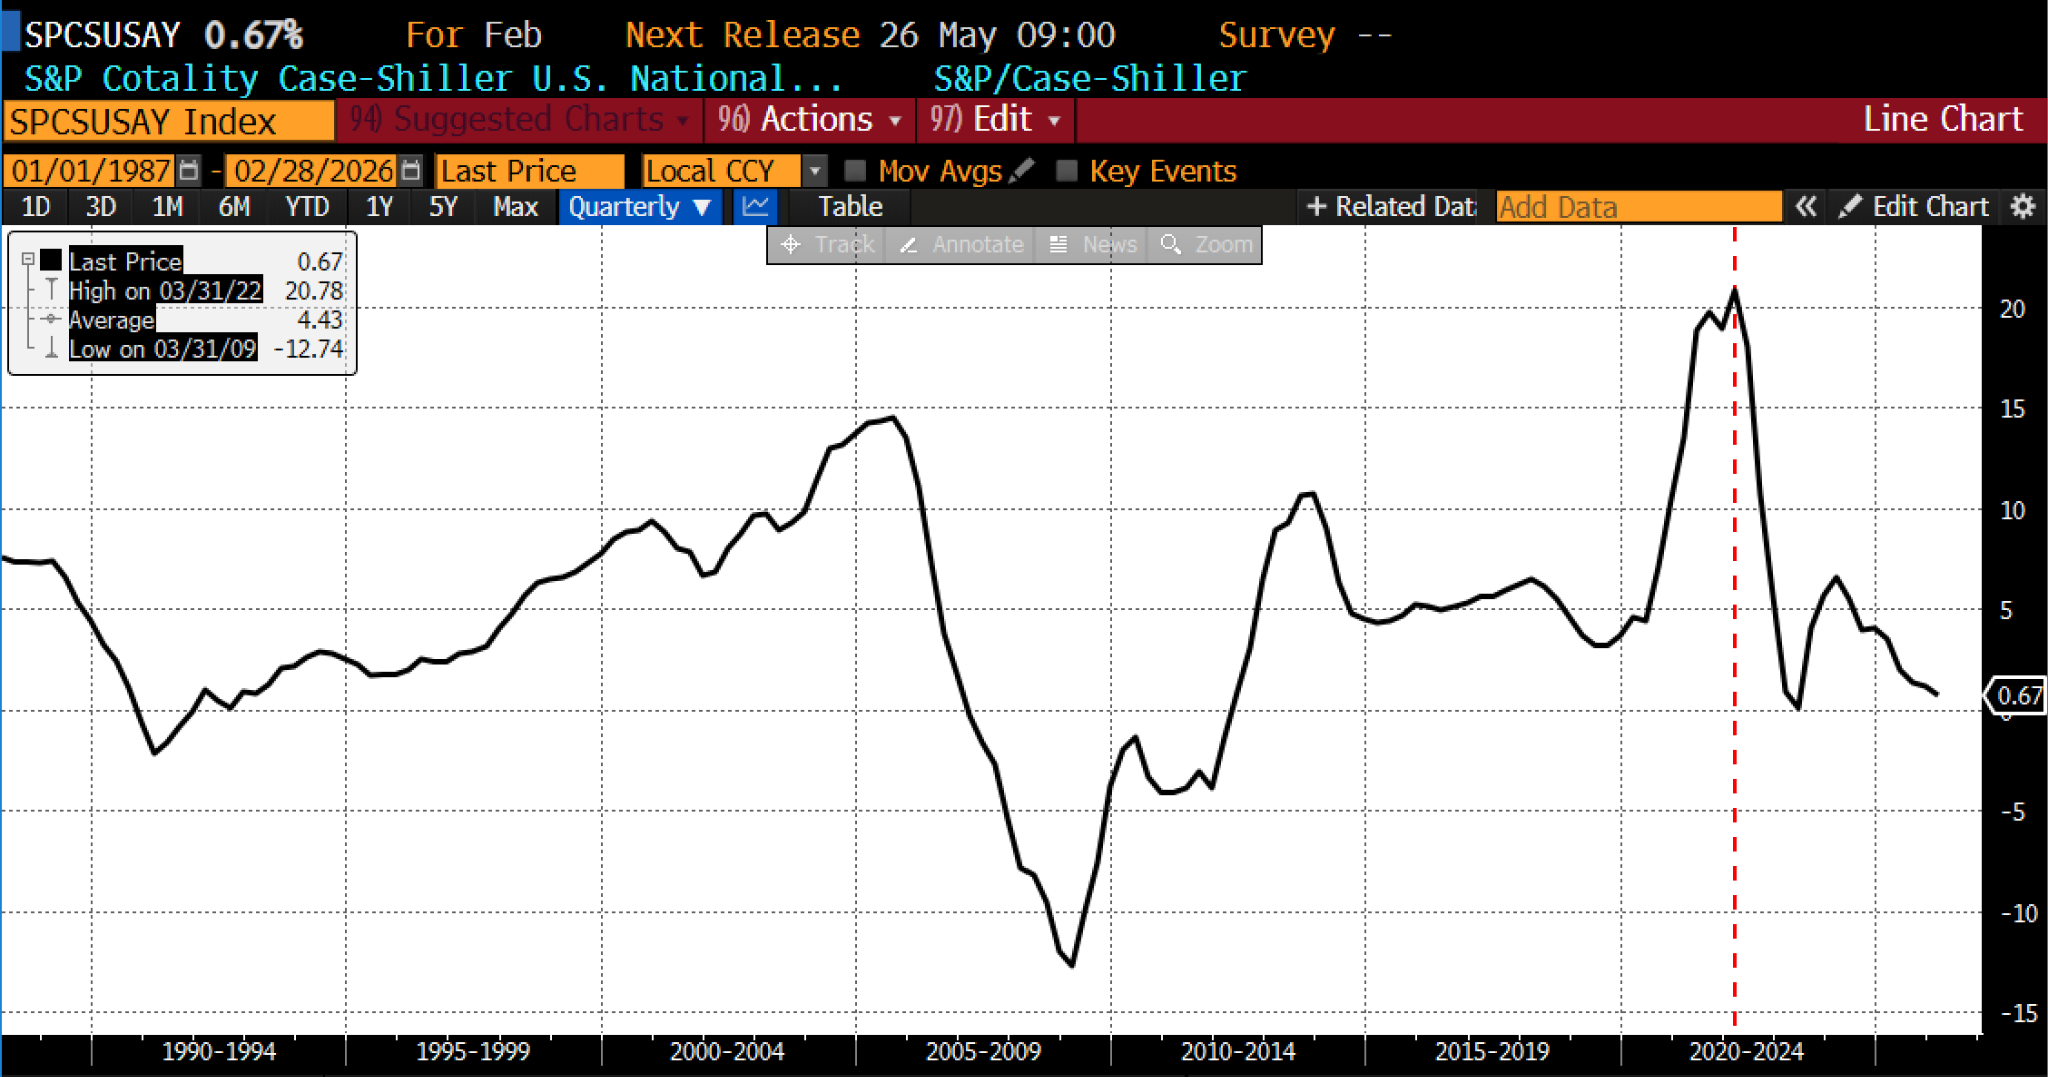
A related consideration is price momentum. Over the past year, the rate of home price appreciation has slowed markedly, falling to low single digits in nominal terms and, in some cases, approaching zero in real terms. This represents a sharp departure from the double-digit gains recorded during the 2020–2022 period. In certain recent observations, inflation has exceeded nominal price growth, implying a gradual decline in real home values. The combination of flat prices and weak sales further suggests that the market is adjusting through activity rather than through outright price declines. This is depicted in the S&P Case-Shiller US National Home Price NSA Index (YOY):
(Source: Bloomberg Finance, LP)
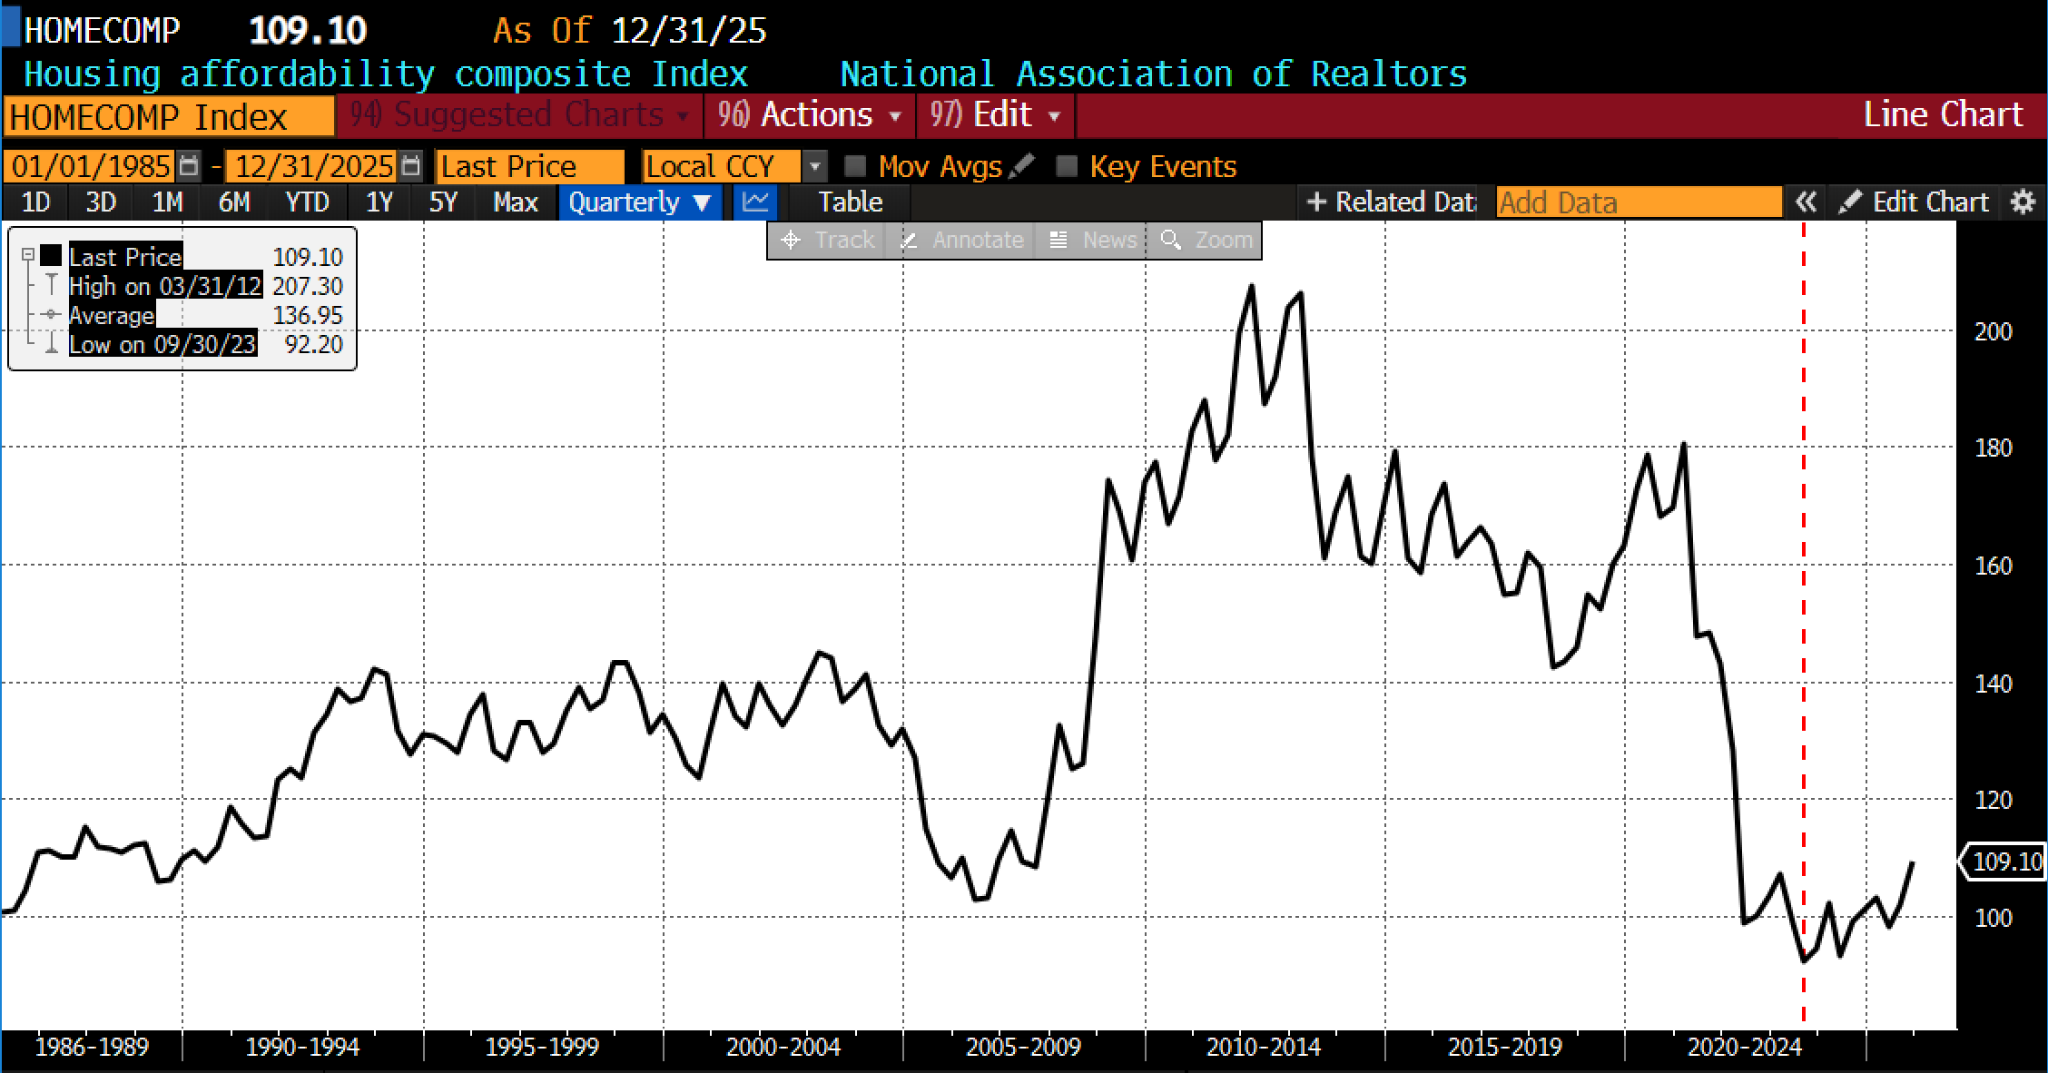
There is also evidence that income growth is beginning to narrow the gap between earnings and housing costs. Wage increases have, in some instances, outpaced home price gains over the past year, contributing to modest improvements in affordability at the margin. Although housing remains historically expensive, the direction of change has become more favorable. Similarly, some composite affordability indices (see the National Association of Realtors Composite Index, below) suggest that the most challenging conditions may have occurred in 2023, when mortgage rates briefly exceeded current levels while prices were already elevated. By that standard, present conditions, while still difficult, represent a modest improvement.
(Source: Bloomberg Finance, LP)
The apparent inconsistency across these measures reflects the unusual sequence of developments in the housing market. The pandemic period produced a substantial increase in home prices, driven by low interest rates, supply constraints, and shifting demand patterns. The subsequent tightening cycle raised borrowing costs significantly but did not generate a commensurate decline in nominal prices. Instead, the adjustment has occurred through reduced transaction volumes, diminished affordability, and a growing divergence between ownership and rental costs.
The most coherent interpretation is as follows. By nominal levels and by traditional valuation metrics such as price-to-income ratios, US housing remains extremely expensive. By affordability measures that incorporate mortgage rates, it is still near historically unfavorable levels. However, by inflation-adjusted prices, by the shift toward renting, and by recent trends in both prices and incomes, the peak in expensiveness has likely already passed. Aggravating conditions such as sellers anchoring to reservation prices and a growing reluctance to incur high taxes and transaction costs add additional dimensions.
These conclusions, moreover, are not contradictory. Housing can remain exceptionally costly in absolute and relative terms while simultaneously becoming less overvalued at the margin. The distinction lies in the choice of metric: whether one emphasizes relative levels, purchasing power, or the shifting balance between prices, incomes, and financing conditions. Taken together, home prices remain substantially elevated by virtually any reasonable metric, even if they are not uniformly at historical extremes across all measures. That distinction, while analytically significant, offers little practical consolation — and no solution — for prospective buyers against whom the combined effects of high prices and elevated financing costs continue to present a formidable barrier to homeownership.